Metrics
Introduction
The Metrics App provides a building block for reporting of ownCloud Server. For simple use cases, it ships with an integrated dashboard that summarizes information about users, storage as well as shares and allows exporting it to a CSV file. Additionally, it adds a Metrics HTTP API endpoint to ownCloud Classic, which can be used to obtain the Metrics data in regular intervals. Thus, more sophisticated analysis and visualizations can be conducted.
The metrics data is provided as snapshot values in JSON format and is optimised for consumption by professional data analysers, such as Splunk, ELK and Prometheus/Grafana, for the collection of statistics, the creation of visualisations and the setting of alerts for certain events of interest. They can be seamlessly integrated with the ownCloud Audit Logs, which are provided by the Auditing App to collect time series data and create a reporting engine for ownCloud.
If you want to use Splunk in addition, check out ownCloud App for Splunk.
Specifically, the Metrics extension adds:
-
an API endpoint which allows querying snapshot values of the system data as well as per-user metrics
-
API endpoints for downloading metrics as CSV files
-
a dashboard that displays the snapshot data in the ownCloud Web UI and offers a CSV download in the system view and the user view.
| If you’re operating very large instances with regard to users, files or shares, better use a special setup so you won’t put the production database under huge load when gathering the values. For this, replicate your installation (application server and read-only database) and install and use the Metrics app on the replica. |
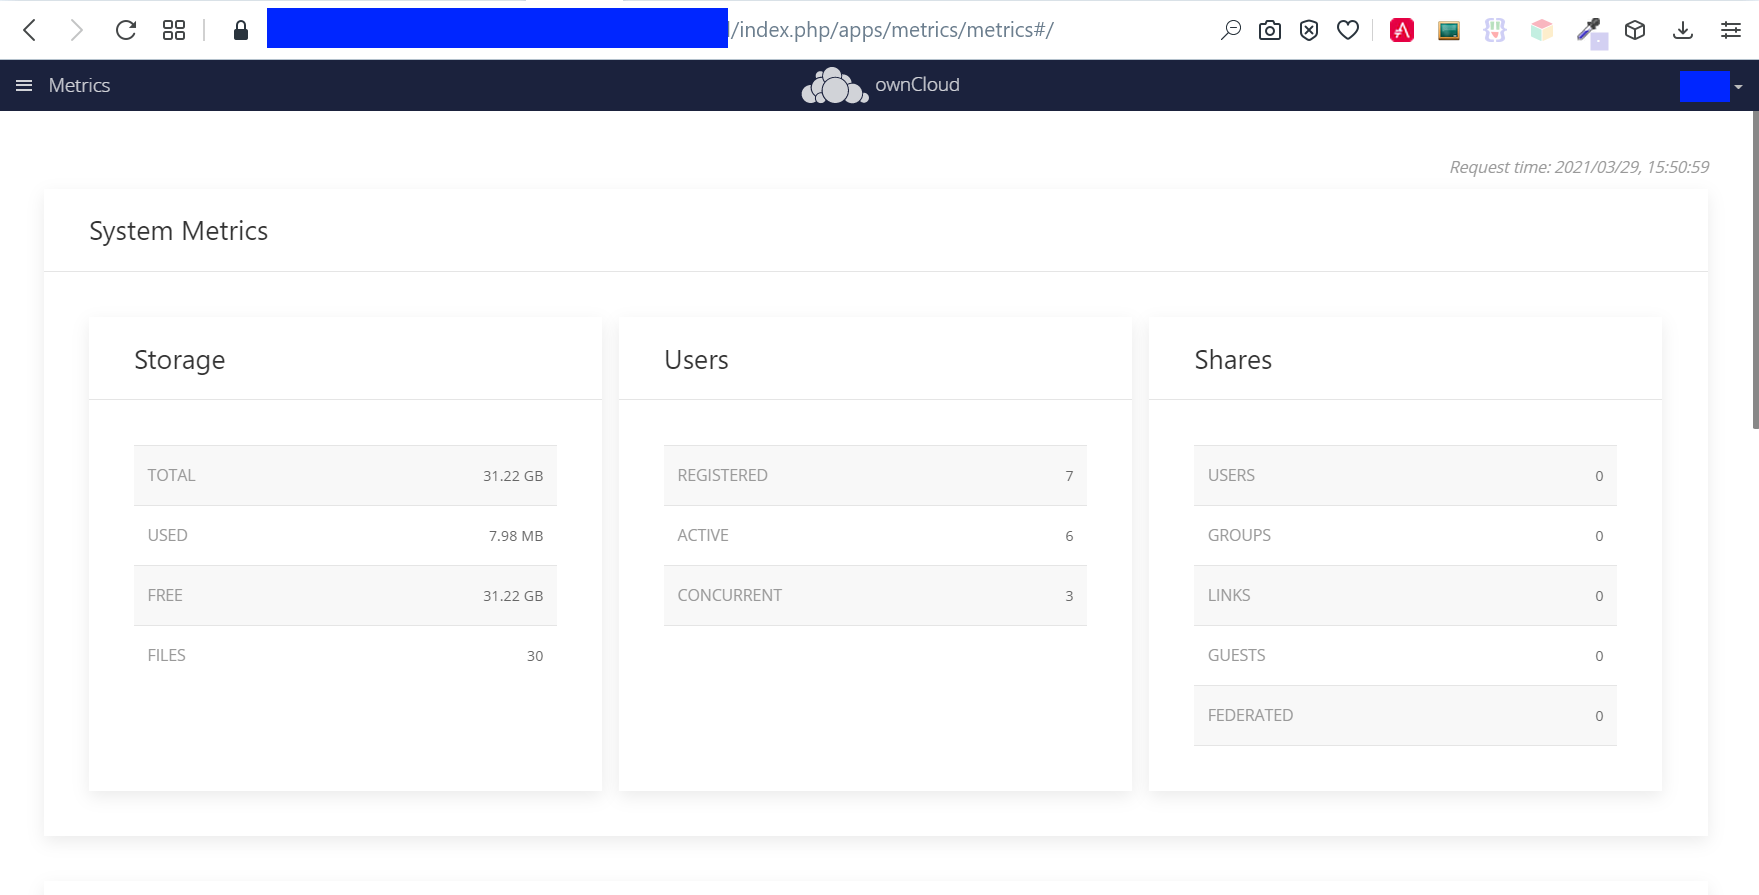
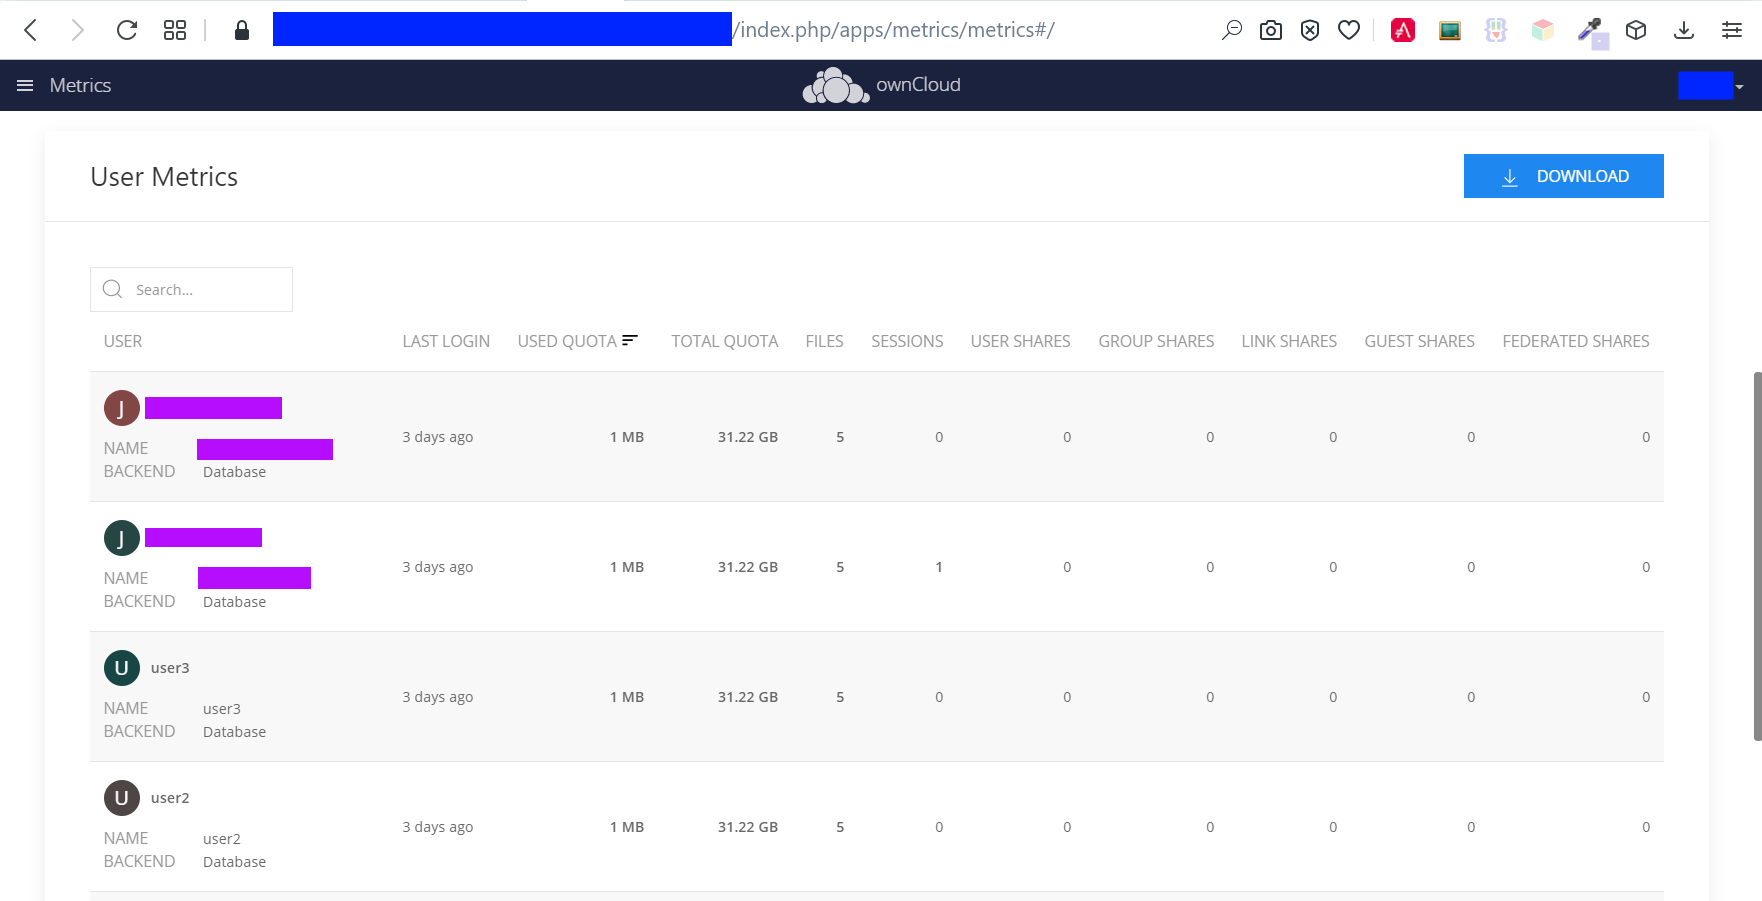
The following screenshots give you an impression of the Metrics app.
| Metrics System Overview | Metrics User Overview |
|---|---|
|
|
Available Data
The following data is available for analysis:
-
Date/Time stamp - Server time of the request
-
Storage
-
Used storage (this includes both, data that count against user Quotas
usedQuota, andusedOtherlike avatars, thumbnails and file versions) -
Free storage
-
Total storage (used + free)
-
Number of files
-
-
Number of users
-
registered (total number of known users)
-
active (number of users with
lastLoginless than two weeks ago) -
concurrent (number of users with at least one active session)
-
-
Shares
-
Number of user shares
-
Number of group shares
-
Number of guest shares
-
Number of link shares
-
Number of federated shares
-
-
User ID
-
Display name
-
User backend
-
Last login
-
Active sessions
-
Quota
-
Quota limit
-
Quota usage
-
-
Number of files
-
Shares
-
Number of user shares
-
Number of group shares
-
Number of guest shares
-
Number of link shares
-
Number of federated shares
-
Usage
Authorization
To get started, you have to set a secret for authenticating requests at the endpoint.
See the following occ command on how to set it. Make up a passphrase, referred to as <your-metrics-secret> in the example below. The Metrics secret is necessary to use the dashboard.
docker compose exec owncloud occ config:system:set "metrics_shared_secret" --value "<your-metrics-secret>"
This token gets stored in config.php as metrics_shared_secret, which could also be done manually instead of using the occ command.
|
Dashboard User Interface
The dashboard is enabled by default. You can disable it with the following command:
docker compose exec owncloud occ config:app:set metrics disable_dashboard --value=yesEndpoints and Parameters
Metrics Endpoint
To query for the Metrics data, use the following endpoint:
https://<your owncloud>/ocs/v1.php/apps/metrics/api/v1/metrics-
URL Parameters
-
users=true -
shares=true -
quota=true -
userData=true -
format=json
-
-
Header
"OC-MetricsApiKey: <your-metrics-secret>"
Except for the header, all other parameters are optional. You can split the query into parts by setting the respective parameters to false.
See the curl example to request the complete output:
curl -H "OC-MetricsApiKey: <your-metrics-secret>" \
"https://<your owncloud>/ocs/v1.php/apps/metrics/api/v1/metrics?users=true&files=true&shares=true"a=true&userData=true&format=json"
Replace <your-metrics-secret> with your respective system config value and <your owncloud> with the URL of your ownCloud instance.
|
CSV Download Endpoints
Downloading the current user and system metrics as CSV files is possible via the Web UI. If you want to set up cron jobs for downloading the metrics regularly without admin permissions, there are also public endpoints that require the configured token instead of admin privileges.
In the following curl examples, replace <your-metrics-secret> with your respective system config value and <your owncloud> with the URL of your ownCloud instance.
|
To receive user metrics, use:
curl -H "Content-Type: application/csv" \
     -H "OC-MetricsApiKey: <your-metrics-secret>" \
     -X GET https://<your owncloud>/index.php/apps/metrics/download-api/users > \
     /path/to/download/storage/user-metrics.csv
For system metrics, use:
curl -H "Content-Type: application/csv" \
     -H "OC-MetricsApiKey: <your-metrics-secret>" \
     -X GET https://<your owncloud>/index.php/apps/metrics/download-api/system > \
     /path/to/download/storage/system-metrics.csv