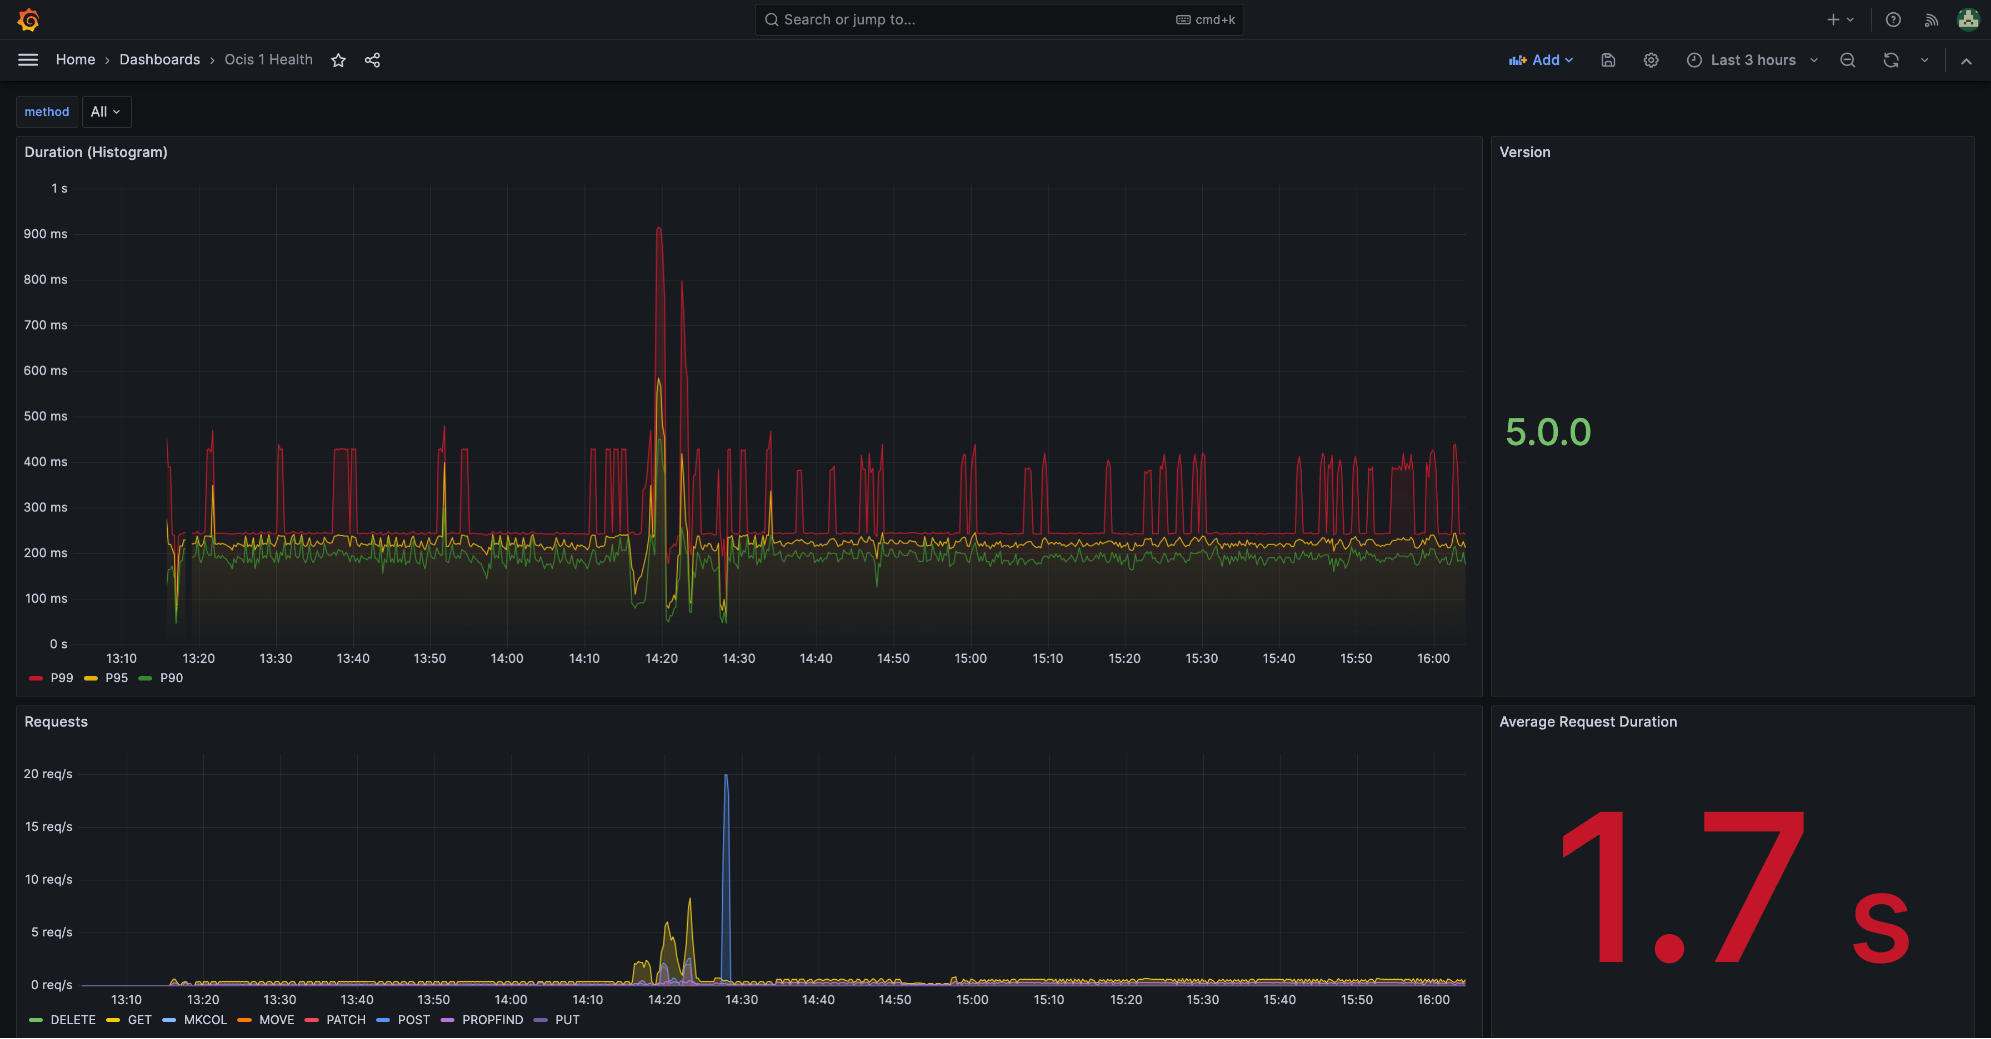
Metrics for Prometheus
Introduction
Infinite Scale exposes metrics in the prometheus format. This document gives more details how to implement and access it. Also see the Prometheus documentation for more details.
Metrics
The Infinite Scale proxy service exposes metrics in the prometheus format. These metrics are exposed on the /metrics endpoint. There are two ways to run the ocis proxy service which has an impact on the number of metrics exposed.
- Single Process Mode
-
In single process mode, all Infinite Scale services are running inside a single process. This is the default mode when using the
ocis servercommand. It is also partially true with the docker compose examples (There, both the single process and standalone mode is used). In this mode, the proxy service exposes metrics about the proxy service itself and about the services it is proxying. This is due to the nature of the prometheus registry which is a singleton.-
Metrics exposed by the proxy service itself are prefixed with
ocis_proxy_. -
Metrics exposed by other ocis services are prefixed with
ocis_<service-name>_.
-
- Standalone Mode
-
In this mode, a service has been started independently and outside the single process mode. Either via an own defined service startup or a startup as own container via docker. The metrics of the following services are exposed on their own metrics endpoint:
activitylog
eventhistory
graph
idp
invitations
ocs
proxy
search
settings
thumbnails
userlog
webdav
webfinger
web
Available Metrics
The following metrics are exposed by the proxy service:
| Metric Name | Description | Labels |
|---|---|---|
|
Counter metric which reports the total number of HTTP requests. |
|
|
Counter metric which reports the total number of HTTP requests which have failed. That counts all response codes >= 500 |
|
|
Histogram of the time (in seconds) each request took. A histogram metric uses buckets to count the number of events that fall into each bucket. |
|
|
A metric with a constant |
|
Prometheus Configuration
The following is an example prometheus configuration for the single process mode. It assumes that:
-
the proxy service is configured to bind on all interfaces
PROXY_DEBUG_ADDR=0.0.0.0:9205and -
the proxy is available via the
ocisservice name (typically in docker-compose environments).
The prometheus service detects the /metrics endpoint automatically and scrapes it every 15 seconds.
| Note that Metrics are on the debug port 9205 and not on port 9200 ! |
global:
  scrape_interval: 15s
scrape_configs:
  - job_name: ocis_proxy
    static_configs:
    - targets: ["ocis:9205"]